Rating Metrics Shape Payment Decisions for US Online Poker Participants
Yara Hughes · Jul 25, 2026

Rating Metrics Shape Payment Decisions for US Online Poker Participants
Rating metrics in US online poker environments encompass transaction speed, security protocols, fee structures, and verified user reviews that collectively steer how participants select funding and withdrawal options across digital card rooms, and these systems have gained prominence as more states expand regulated play through mid-2026.
Core Components of Rating Systems
Participants review aggregated scores that combine processing times measured in hours or minutes, encryption standards certified by independent auditors, and historical success rates for both deposits and cashouts, while platforms display these figures alongside volume statistics drawn from thousands of completed transactions each month. Data from state gaming reports shows that platforms maintaining average withdrawal approvals under four hours receive higher visibility in search rankings, adn this visibility directly correlates with increased user adoption of those specific payment rails.
Security ratings factor in multi-factor authentication requirements along with compliance documentation submitted to bodies such as the Nevada Gaming Control Board, whereas fee transparency metrics highlight any hidden charges that surface during high-volume periods around major tournament series. Researchers tracking behavior patterns note that when a metric drops below an established threshold, users migrate toward alternatives within the same session rather than completing the original transaction.
How Metrics Influence Specific Payment Choices
Players compare crypto options against traditional bank transfers by examining side-by-side metric displays that list confirmation block times, network congestion indicators, and platform-specific cashout limits, and those comparisons often favor cryptocurrencies during peak summer tournament months when volume spikes. One documented case revealed that after a platform updated its rating dashboard to highlight sub-two-hour crypto processing, the share of users selecting digital assets rose steadily over subsequent weeks.
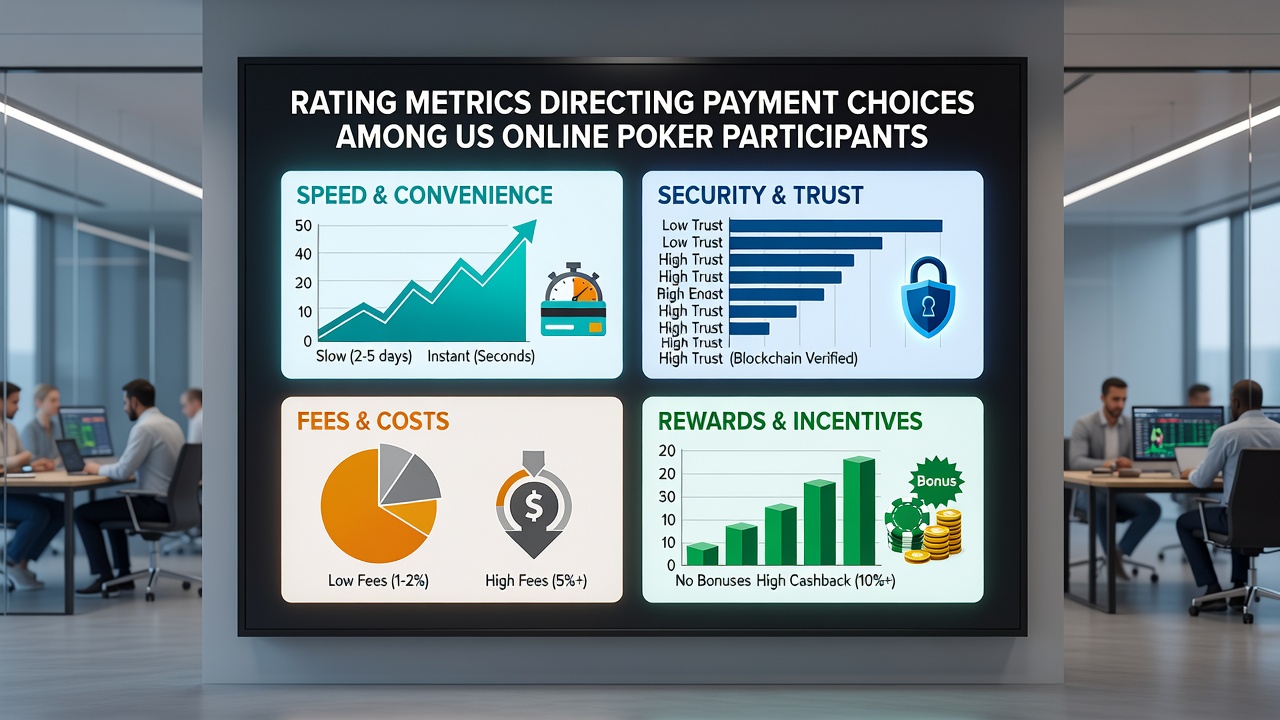
Bank wire and e-check ratings emphasize regulatory oversight and chargeback protections, yet these methods receive lower marks on speed, prompting many participants to reserve them for larger, less frequent transfers while routing smaller amounts through faster-rated channels. Observers tracking multi-state user panels report that individuals frequently maintain accounts across several payment providers precisely because rating updates allow quick switches when one service experiences temporary dips in performance scores.
Regional Variations and Platform Adaptations
In states with mature markets such as New Jersey and Pennsylvania, rating dashboards incorporate additional filters for local tax withholding rules and jurisdictional compliance badges, whereas emerging markets like Michigan display simpler speed-and-security summaries that still guide daily choices. Platforms respond to these regional differences by adjusting which metrics appear first in mobile interfaces, and evidence from industry reports indicates that prominent placement of top-rated methods increases overall transaction completion rates.
Canadian regulatory frameworks and Australian gaming research have supplied comparative datasets that US operators reference when refining their own scoring algorithms, allowing cross-border insights into how fee transparency affects long-term user retention. Those who've studied platform analytics note that July 2026 updates to several major sites introduced real-time metric refreshes tied directly to live transaction logs, reducing the lag between reported issues and visible rating adjustments.
Effects on User Behavior and Platform Strategy
Participants who regularly consult rating summaries demonstrate more consistent selection patterns across sessions, often locking in a primary method once it maintains strong scores for consecutive weeks. Platform operators, in turn, allocate development resources toward improving the lowest-scoring metrics, since sustained visibility in user dashboards drives higher deposit volumes and reduces support ticket volume related to payment disputes.
Academic studies examining transaction logs from multiple operators confirm that metric-driven choices produce measurable shifts in payment mix within 30 days of any dashboard change, and these shifts persist even after promotional incentives expire. The pattern holds across both recreational and high-volume players, suggesting the influence operates independently of individual bankroll size.
Conclusion
Rating metrics continue to function as primary decision tools that organize payment preferences among US online poker participants, with platforms refining displays and users adapting selections in response to updated scores. Ongoing regulatory developments and cross-jurisdictional data exchanges sustain this feedback loop, shaping which methods gain traction as markets mature through 2026 and beyond.